UX HeatGrid
 Chrome extension
See what stands out on a page, and how you use it.
A side-panel inspector for people who design and review web pages. It estimates which controls stand out, records your own session, and shows both on the page. Everything stays in your browser.
What it does
Predict
Ranks every button, link and control into High, Medium and Low structural prominence, based on size, position, visual style, text contrast, nearby competing controls and page context. It estimates what stands out visually, not where people will look or click.
Record
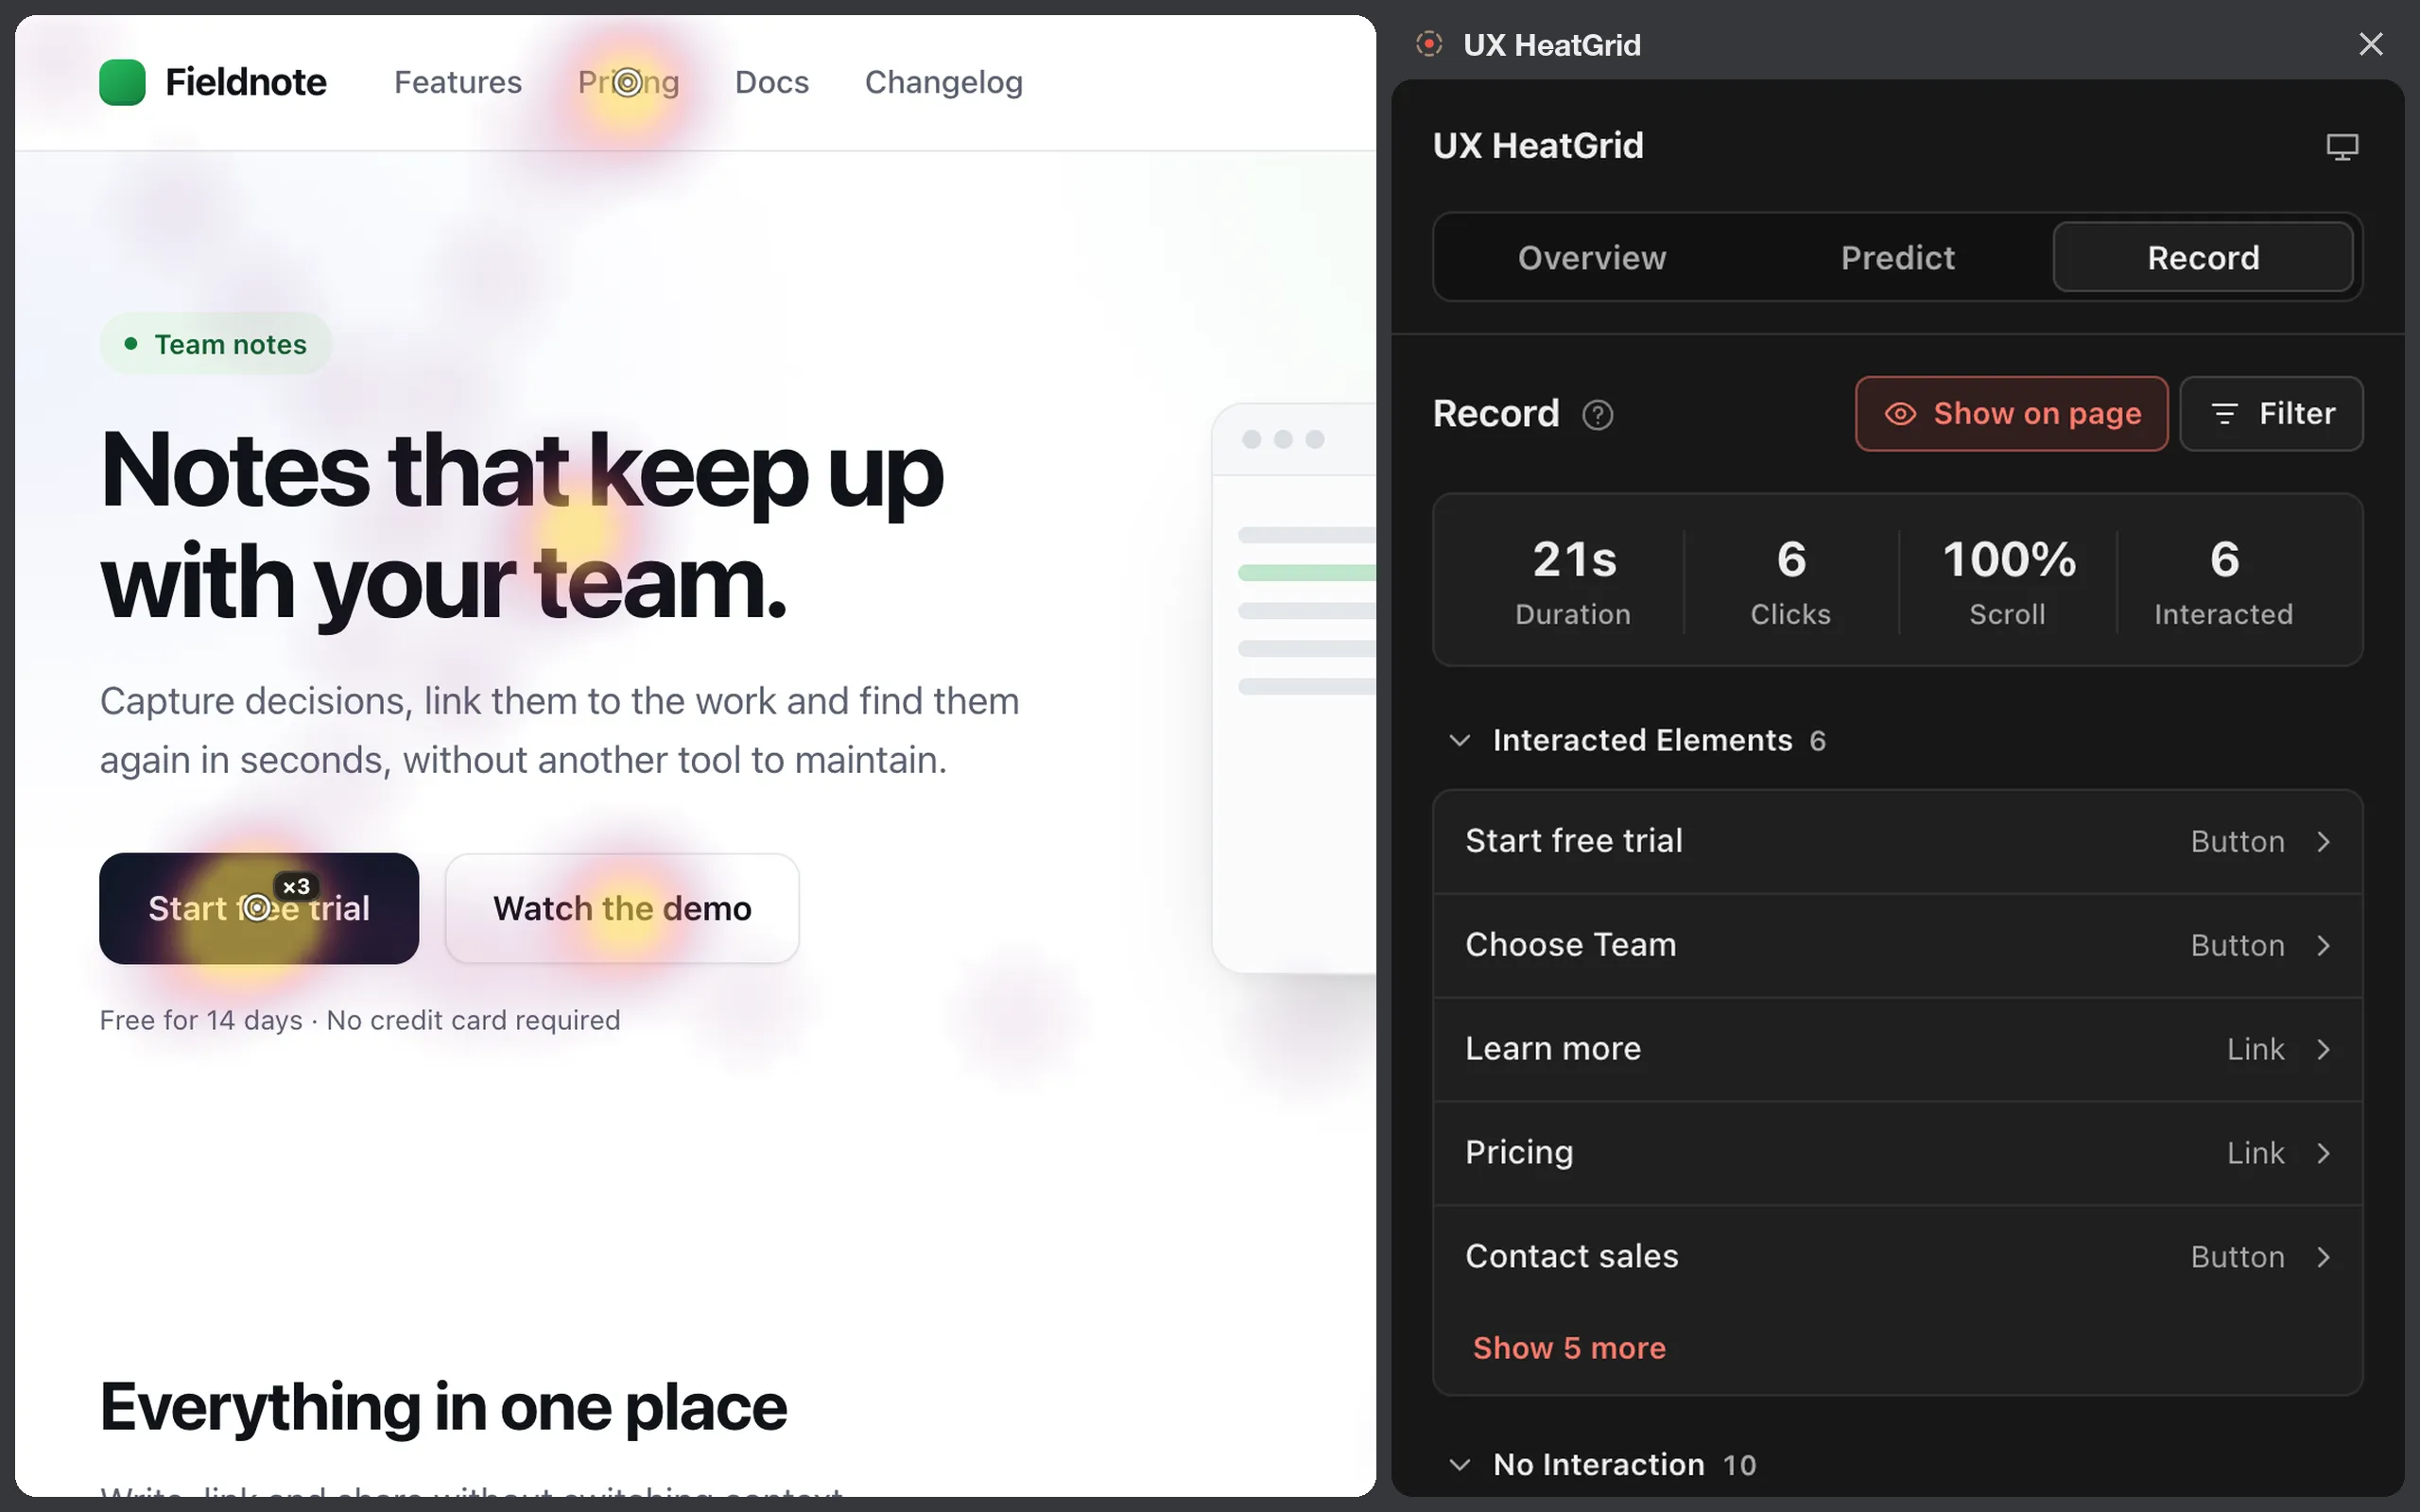
Captures your own session on the page: clicks, hover, focus, time in view and scroll depth. Controls that were in view but never used are listed separately. It records you, in your browser, not a site’s visitors.
Inspect
Expand any result to see the evidence behind it, from the measured factors in Predict to the clicks and time in view in Record. The matching element is highlighted on the live page.
Reasons and confidence
Each prediction lists Positive and Negative factors written from measured values, such as a control’s size, its contrast ratio or the number of nearby controls. Confidence shows how settled the band is.
On-page overlays
Show on page outlines predicted controls by band, or draws a recording as a heatmap, click markers and scroll depth, each with its own toggle.
How it works
Open the side panel
Click the UX HeatGrid icon in the toolbar. The side panel opens with Overview, Predict and Record views.
Run Predict
Press Start under Predict to rank the page’s controls. No recording is needed, and results are marked as stale when the page changes.
Record a session
Press Start under Record, use the page as usual, then press Stop. The session continues across same-site navigations and reloads.
Review on the page
Press Show on page in either view to draw the results on the page, then expand a result to inspect it.
Before you install
Browser support
Chrome 116 or newer, with the side panel.
What the results mean
Predict reads page structure, not people. Record covers only your own session and does not track other visitors.
Supported pages
Works on regular websites, but not on Chrome’s own pages or in the Chrome Web Store. Content inside cross-origin iframes is not analyzed or recorded.
Privacy
UX HeatGrid has no accounts, servers, analytics or tracking, and makes no network requests. It never reads form values or the keys you type, and recordings are cleared when you reset them, close the tab or end the browser session. Privacy policy, opens in a new tab
Install UX HeatGrid and inspect any page’s controls from Chrome’s side panel.
Add UX HeatGrid to Chrome, opens the Chrome Web Store in a new tab